Table of Contents
ToggleThe New Cost-Benefit Formula: ROI Calculation and Implementation Path of Flexible Automatic Assembly Equipment

Introduction
Facing market pressures of “multi-variety, small-batch” production, SMEs commonly encounter three puzzles when introducing flexible automatic assembly equipment: “Can equipment investment be recouped within 3 years?” “How to quantify the implicit value of flexible production?” “How to avoid resource waste from blind investment?” This article constructs an ROI calculation model with 12 core indicators. Combining practical cases from automotive parts, 3C electronics, and medical device industries, it provides a full-process implementation guide from investment evaluation to continuous optimization, helping enterprises clarify the economic accounts of “flexible transformation.”
I. Core ROI Calculation Model: Full-Dimensional Evaluation from “Explicit Costs” to “Implicit Values”
The benefits of flexible equipment exhibit characteristics of “short-term cost increase, long-term value fission,” requiring an evaluation system covering five dimensions: equipment investment, labor substitution, quality improvement, capacity flexibility, and asset reuse.
1. Explicit Cost Saving Formula (1-3 Year Short-Term Return)
Annual explicit cost savings = (Labor cost savings + Quality cost savings + Energy consumption savings) − Equipment O&M costs
- Labor cost savings: Take a 10-station assembly line as an example. Traditional lines require 15 workers (monthly salary ¥6,000), while flexible equipment reduces it to 5, saving ¥720,000 annually (10 workers × ¥6,000 × 12).
- Quality cost savings: Defect rate drops from 5% in traditional lines to 1.5%. For products with ¥100 unit price and 500,000 annual output, annual rework/scrap cost reduction is ¥175,000 (500,000 × (5%−1.5%) × ¥100).
- Energy consumption savings: Servo motors of flexible equipment save 40% energy compared to traditional pneumatic systems, reducing annual electricity costs from ¥800,000 to ¥480,000, a saving of ¥320,000.
- O&M costs: Including consumables (e.g., grippers, vision light sources), software licenses, and annual calibration, accounting for 8%-12% of equipment 原值 (original value). Assuming ¥5 million equipment investment, annual O&M costs are ¥400,000-¥600,000.
Case: After introducing flexible equipment, a domestic auto parts factory achieved ¥1,015,000 in first-year explicit savings (72+17.5+32−20), with ¥5 million investment and a static payback period of ~4.9 years. Tax optimization is realized through accelerated depreciation (3 years).
2. Implicit Value Appreciation Model (3-5 Year Long-Term Return)
- Order response premium: Enables 4-hour rapid model switching, accepting multi-variety orders (e.g., minimum order quantity reduced from 5,000 to 500 pieces), with unit price increased by 15%-20%. A 3C manufacturer thus obtained high-end customer orders, increasing annual revenue by ¥12 million.
- Capacity flexibility value: Through mixed-line production, equipment utilization rate rises from 60% in traditional lines to 85%, equivalent to “1 line doing 1.4 lines’ work,” saving factory rental and repeated equipment investment costs.
- Data asset precipitation: Accumulated 200,000+ process parameters and 50,000+ defect samples, usable for AI quality prediction models, shortening new product R&D cycles by over 30% in the future.
II. Implementation Path: Four Stages to Achieve “Precision Investment + Rapid Results”
Stage 1: Current Situation Diagnosis — Pinpoint Pain Points with Data (1-2 Months)
- Toolset:
- OEE analysis: Identifies three major pain points in traditional lines: “model switching loss (35%),” “incoming material waiting (20%),” and “quality rework (25%).”
- Product family clustering analysis: Uses Pareto principle to screen 20% core products accounting for 80% output value, evaluating process similarity (e.g., shared fixture rate ≥60% is suitable for priority flexibility).
- Output: Formulates the Flexibility Transformation Priority Matrix, defining 3-5 key processes for initial renovation (e.g., precision assembly, stations with frequent multi-model switching).
Stage 2: Modular Selection — Reject “Large & Comprehensive,” Focus on “Small & Special” (3-4 Months)
- Three selection principles:
Process compatibility: Prioritize equipment supporting “quick-change fixtures + parameter self-learning” (e.g., end fixture replacement time ≤5 minutes, parameter call error ≤0.5%).
ii. System openness: Require equipment to support industrial protocols like OPC UA and MQTT for seamless docking with existing MES/PLC systems (a medical device factory incurred ¥300,000 extra integration costs due to incompatible protocols).
iii. Graduated investment: Adopt a hybrid model of “flexible core stations + semi-automated peripheral stations,” e.g.:
- Precision assembly stations: Invest ¥2 million in full-flexibility units (accuracy ±0.05mm, model switching time 10 minutes).
- Inspection & packaging stations: Retain existing equipment, automate loading/unloading via industrial robots (cost only ¥500,000).
Stage 3: Step-by-Step Implementation — From “Single-Station Pilot” to “Whole-Line Linkage” (6-12 Months)
- Three-step strategy:
Single-point breakthrough: Transform the most complex, labor-dependent station (e.g., mobile phone camera focusing station), achieving yield improvement from 82% to 96% within 3 months to quickly build transformation confidence.
ii. Unit interconnection: Connect 3-5 flexible stations via AGV logistics to form “flexible manufacturing units,” supporting mixed production of 10+ models with model switching time reduced by 70% compared to traditional units.
iii. Whole-line intelligence: Introduce digital twin systems to simulate order scheduling, equipment status, and quality fluctuations in real-time. A German-funded small home appliance factory shortened order delivery cycles from 45 to 18 days through this.
Stage 4: Data Closed Loop — Making Equipment “Smarter” Over Time (Continuous Optimization)
- Value mining paths:
- Establish a Process Parameter Knowledge Base: Store optimal assembly parameters (e.g., pressure, speed, positioning coordinates) for 500+ products, improving new order call efficiency by 90%.
- Develop anomaly prediction models: Analyze equipment vibration, current, and temperature data via LSTM neural networks to warn fixture wear 8 hours in advance (accuracy 92%), avoiding ¥200,000 losses per unexpected shutdown.
- Implement remote O&M: Achieve “remote diagnosis + expert support” for equipment failures via AR glasses, shortening troubleshooting time from 4 hours to 40 minutes and reducing O&M costs by 40%.
III. Risk Control: Three Strategies to Reduce Investment Uncertainties
1. Phased Investment Model
- Adopt a leasing scheme of “30% down payment + production-based payment” (e.g., FlexPay model by some equipment vendors), reducing first-year investment from ¥5 million to ¥1.5 million. The remaining cost is accrued by qualified products (¥1.2/piece), suitable for SMEs with unstable orders.
2. Equipment Reusability Design
- Require suppliers to provide a Cross-Product Family Compatibility Reportto ensure equipment can be expanded to 30%+ potential products in the future (e.g., mobile phone assembly equipment can (compatible with) partial processes for tablets/laptops by changing grippers), avoiding risks of “equipment obsolescence with model iteration.”
3. Ecosystem Cooperation
- Join “flexible manufacturing alliances” to share equipment resources with upstream/downstream enterprises (e.g., a regional 3C enterprise alliance reduced single equipment idle time from 40% to 15% via a sharing platform).
- Choose suppliers offering “process packages” (e.g., turnkey solutions including fixture design, program debugging, and staff training) to avoid project delays due to insufficient technical implementation capabilities (industry statistics show complete process packages shorten implementation cycles by 40%).
IV. Industry Evidence: ROI Difference Analysis for Enterprises of Different Sizes
| Enterprise Type | Investment Scale | Core Benefit Points | Payback Period | Case Characteristics |
| Small (<50 staff) | ¥1-3 million | Labor cost savings (60%) | 2-3 years | Focus on single-process flexibility, e.g., connector assembly |
| Medium (50-300 staff) | ¥5-10 million | Quality cost + order premium (35% each) | 3-4 years | Whole-line renovation, supporting 50+ models mixed production |
| Large (>300 staff) | ¥20+ million | Capacity flexibility + data assets (50%) | 4-5 years | Flexible network layout for global factories |
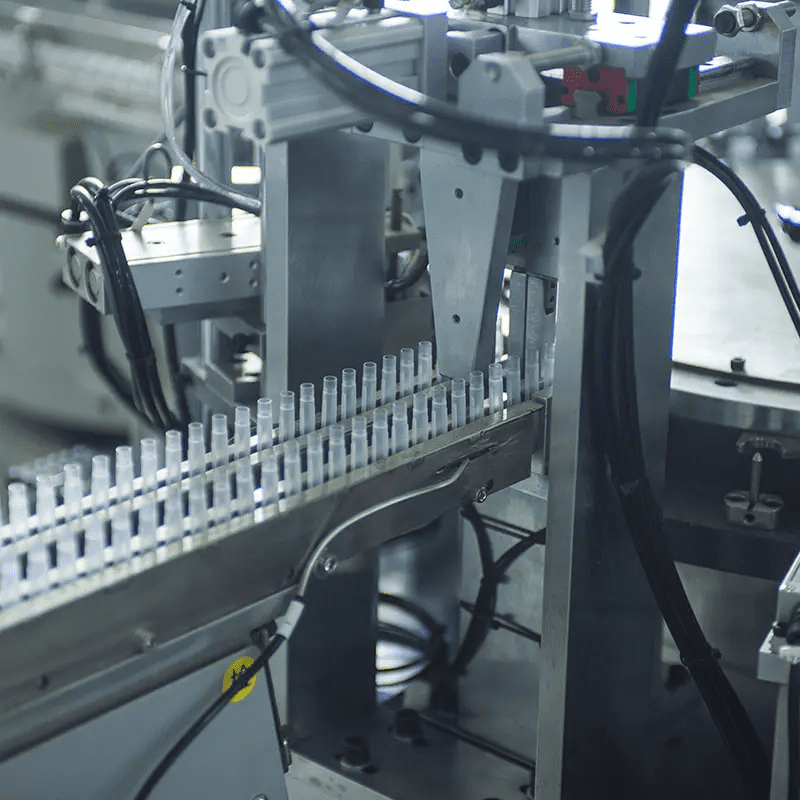
Typical case: A small medical device enterprise invested ¥1.5 million to transform syringe assembly lines, saving ¥480,000 annually by reducing 8 QC positions and ¥220,000 from defect rate dropping from 4% to 0.8%, achieving payback in 1.8 years. It also obtained fast-track EU CE certification (implicit value >¥500,000).
Conclusion
Investment in flexible automatic assembly equipment is not a “cost item” but a “strategic asset” — short-term explicit savings in labor and quality, mid-term value fission in order response and capacity flexibility, and long-term core competitiveness in data-driven and ecosystem integration. Enterprises should abandon the radical mindset of “one-time implementation” and adopt the scientific path of “precision diagnosis – modular selection – step-by-step implementation – data closed loop,” making flexible transformation a “measurable, controllable, and scalable” value project. When ROI calculations include “opportunity costs of missed orders” and “access thresholds for future transformation,” their strategic value far exceeds figures on financial statements. For SMEs aiming to break through in niche markets, this is not a multiple-choice question of “whether to invest,” but a must-answer question of “how to invest smartly and use effectively.”

